Situatie
Activity Monitor gives you all kinds of information about what’s running on your Mac. And you can focus on each process to get a summary of what it is and what it’s doing. If you’re having issues with your Mac running slowly or unpredictably, this information might help you to find the app or background process that’s causing the slowdown.
Solutie
Here’s how to inspect a process on Mac:
1. In Activity Monitor, find a process in the list, and double-click it
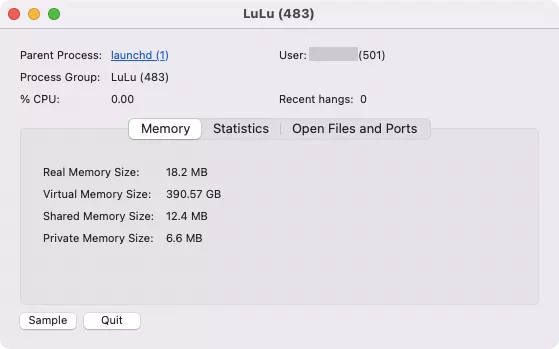
2. This will open a new window with a few tabs. In the Memory tab, you’ll be able to see how much RAM the process is using
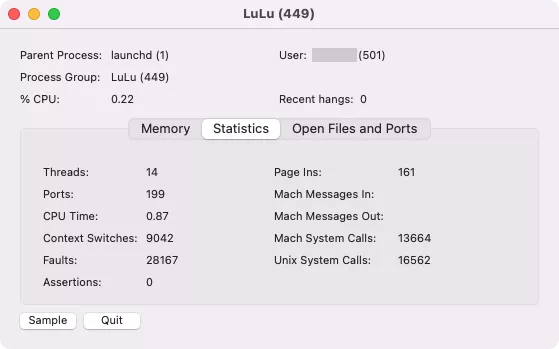
3. Click Statistics to see a range of technical information, including the number of threads a process is using
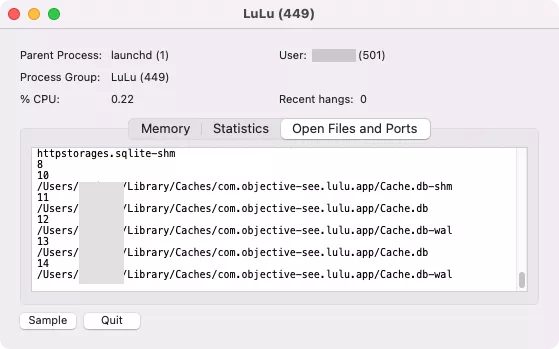
4. The Open Files and Ports tab shows exactly what the name says. You can see exactly which files an is using at any given time
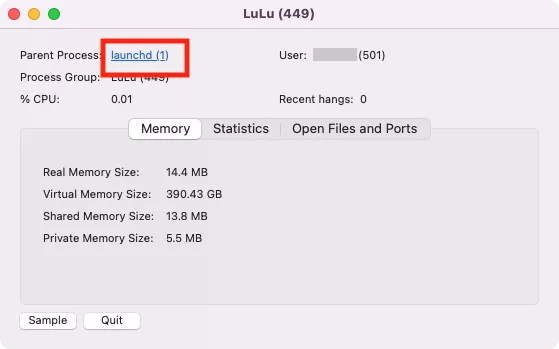
5. If you click next to Parent Process, it will open up another window, with details about that process
Here’s how to run these reports in Activity Monitor:
1. In Activity Monitor, click the icon with three dots
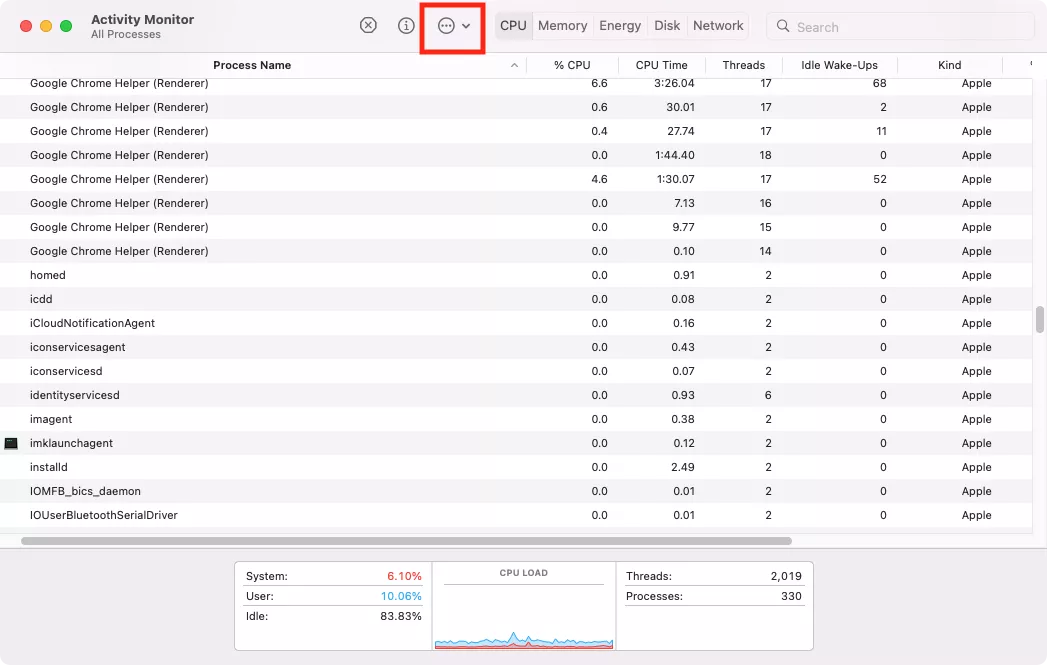
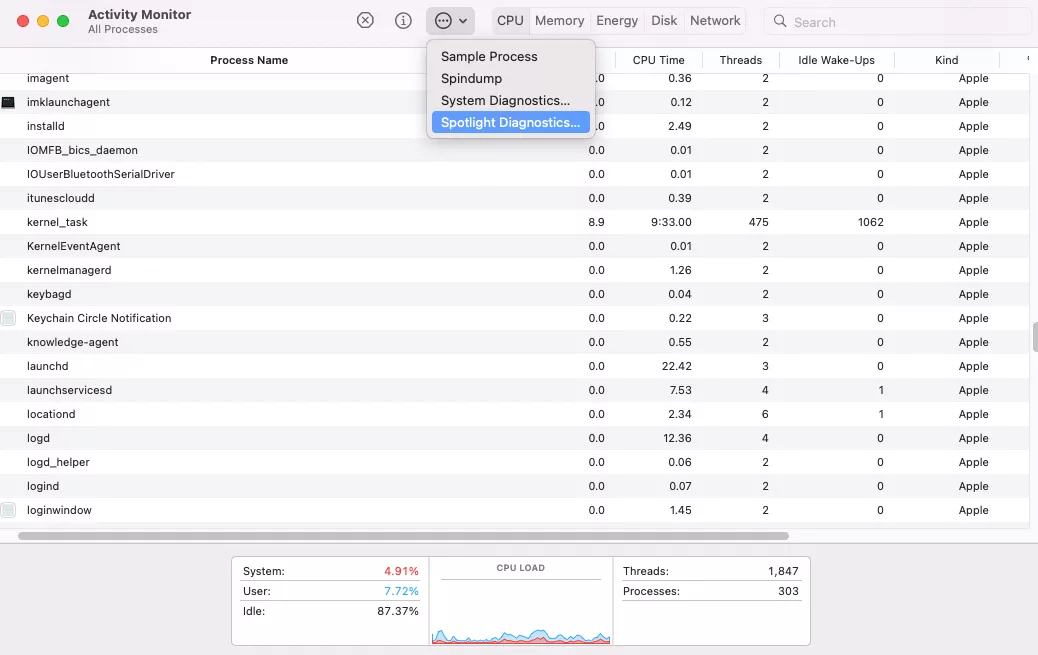
2. Select Sample Process, Spindump, System Diagnostics, Spotlight Diagnostics
3. With some of these, you may need to enter your Mac password. If so, enter it, and let the report build
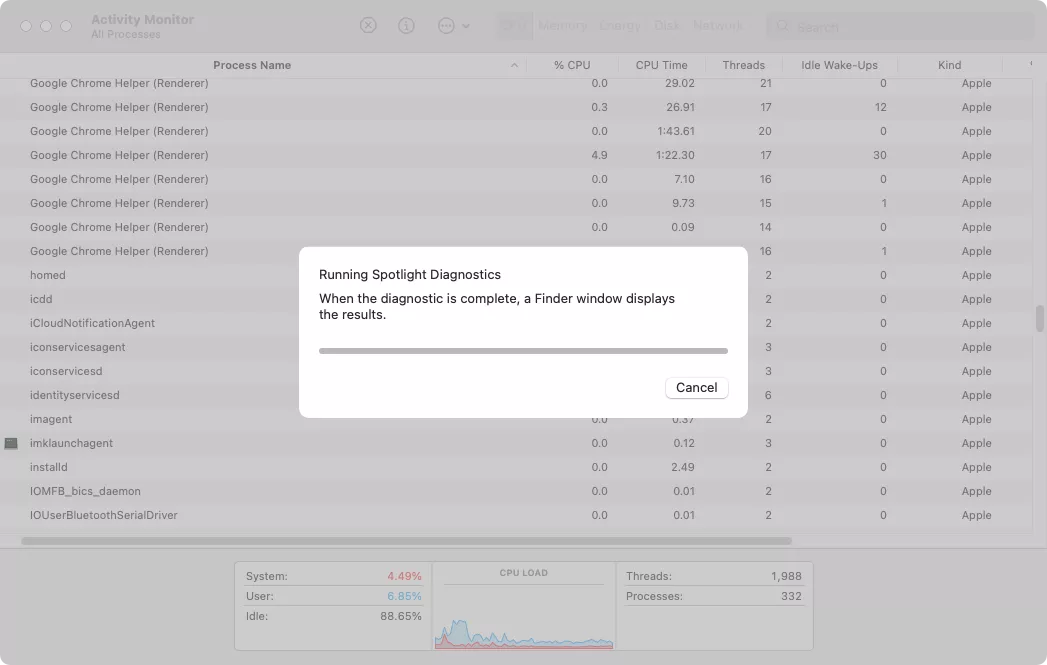
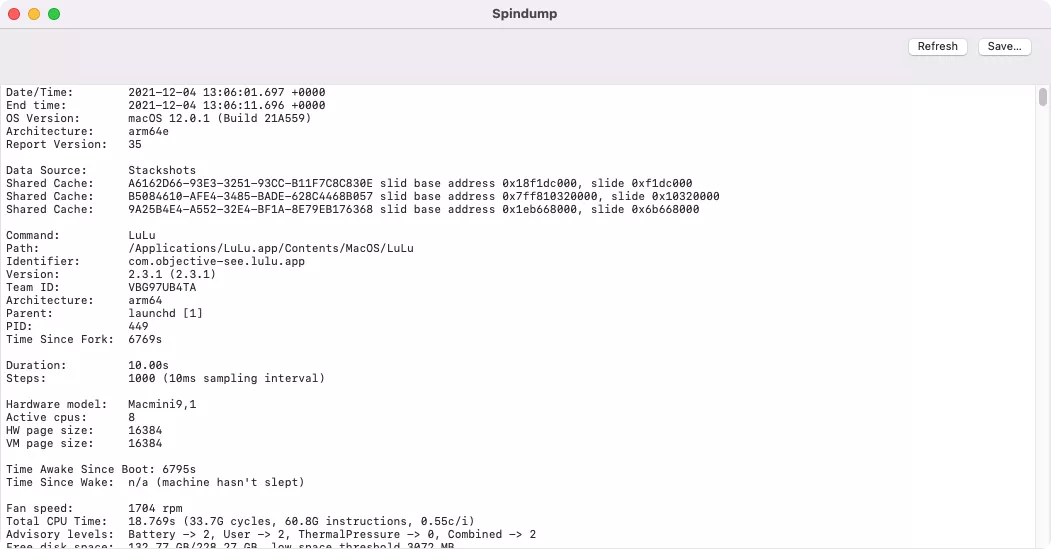
4. At the end, you’ll have a file you can send to Apple Support.

Leave A Comment?