Situatie
Sometimes documents you’re authoring can benefit from an illustrative chart. Rather than taking the time to set up a chart in another application and embedding it or copying and pasting it into Microsoft Word, you can use the built-in chart feature.
Solutie
Create a Chart in Word
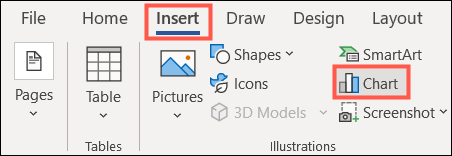
You might be creating a company report, business proposal, or college essay where a data-filled visual is an ideal addition. Place your cursor where you want the chart in your Word document. Then, go to the Insert tab and click “Chart” in the Illustrations section of the ribbon.
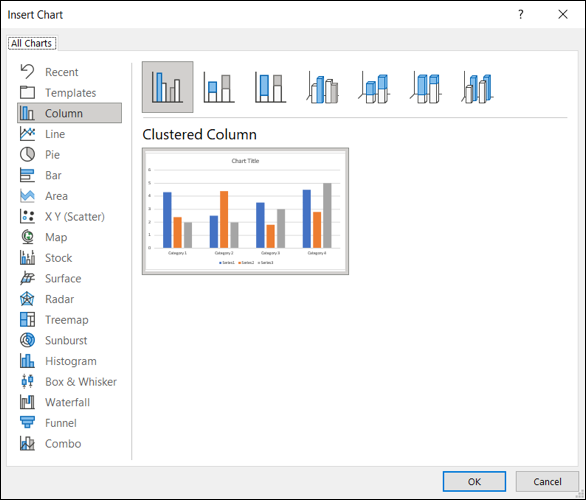
Pick the type of chart you want to add on the left and the style on the right. If you’re familiar with the chart options in Excel, you can choose from the same types in Word like bar, column, pie, line, and many others. Click “OK” to insert the chart.
Once you insert the chart, an Excel spreadsheet will open. The sheet contains sample data to get you started and is a stripped-down version of Excel without tabs or a ribbon.
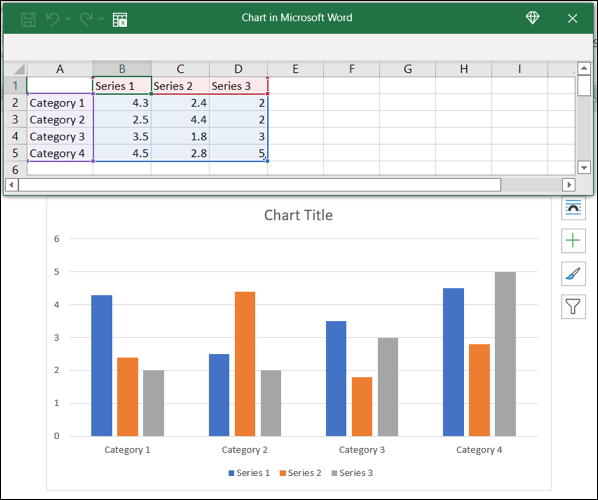
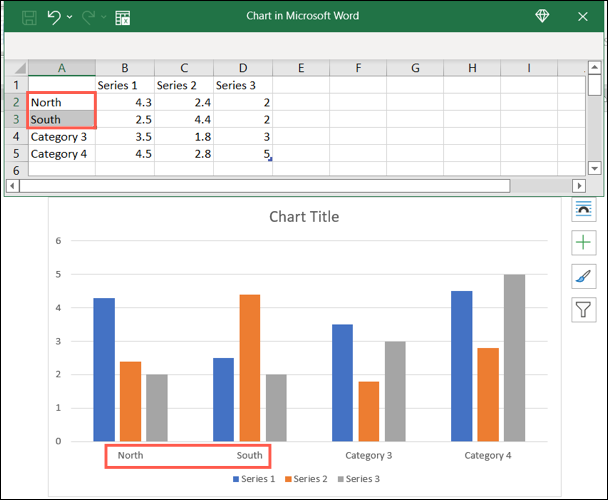
You can edit the data in the spreadsheet to include your own or copy and paste the data from another spot into the attached sheet. You’ll then see the chart in Word immediately update with your changes.
Update the Chart Data
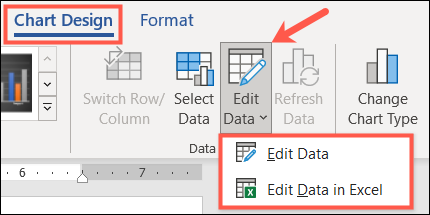
Anytime you want to update the data for the chart, you can do so by heading to the Chart Design tab.
Click the drop-down arrow for Edit Data. Select “Edit Data” to display the small spreadsheet you had when you created the chart, or select “Edit Data in Excel” to open the sheet in a standard Excel window with tabs and a ribbon.
Customize a Chart in Word
Once you insert the chart into Word with the data you want, you can make some customizations. You can add a title, adjust the colors, pick a theme, include a legend, and more. Again, if you’re familiar with customizing charts in Excel, you’ll recognize the below options.
Use the Chart Design Tab
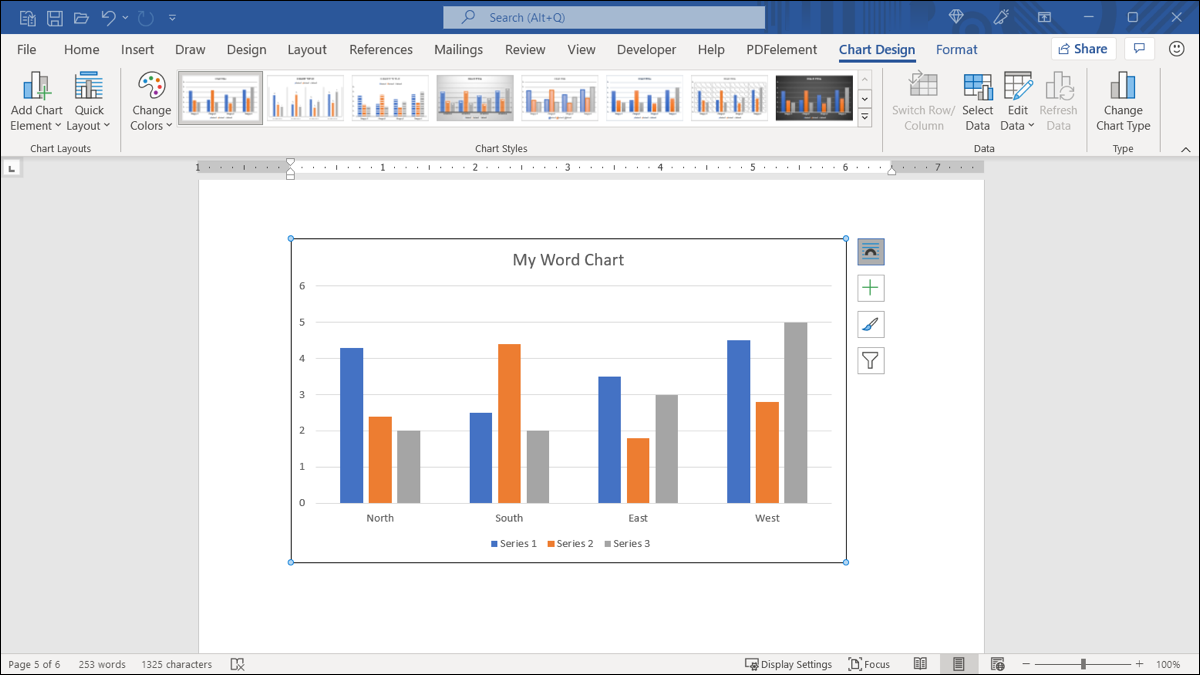
Select the chart and go to the Chart Design tab. Starting on the left side of the ribbon you can add, remove, and position chart elements, change the layout, pick new colors, and select a style.
![]()
On the right side of the Chart Design ribbon, you have an option for Change Chart Type. If you believe a different type of graph would work better with your data, you can select it here.
Open the Format Chart Sidebar
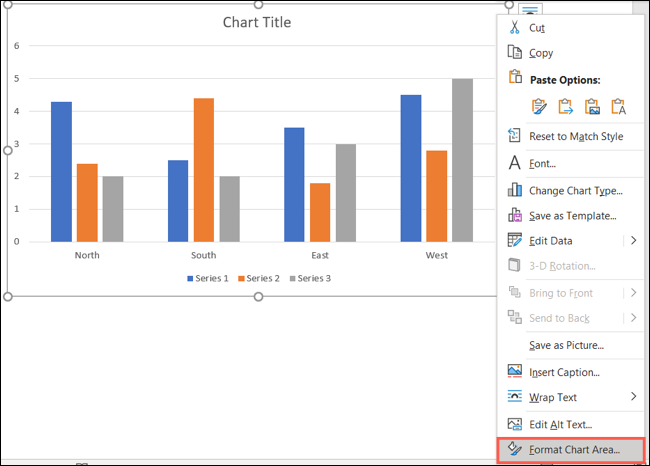
If you’d like to change the font, border, or specifics of the chart like a series or axis, you can use the Format Chart sidebar.
- Right-click the chart and pick “Format Chart Area” or double-click the chart.
- When the sidebar opens, click the arrow next to Chart Options to select a part of the chart to adjust.
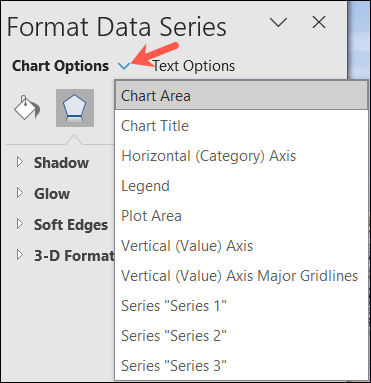
- Use the tabs at the top of the sidebar for fill and line colors, effects, and properties. These tabs change depending on the chart area you select in the drop-down list.

Use the Floating Buttons on Windows
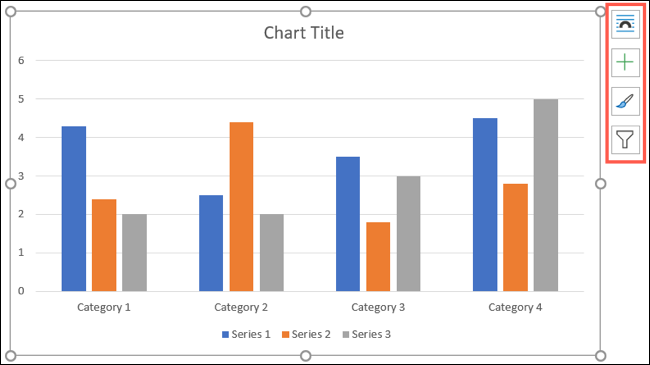
If you’re using Word on Windows, you also have floating buttons for quick changes to your chart. Select the graph, and these will display on the right side.
You can then change the Layout Options for the chart’s placement within the text. You can also use the Chart Elements, Chart Styles, and Chart Filters buttons to adjust items on the chart, choose a color scheme, and apply filters.
Leave A Comment?