Situatie
The Excel FORECAST function uses the least squares or linear regression method to forecast future values. For example, sales, stock requirements, trends etc.
Solutie
Pasi de urmat
Excel FORECAST Function Syntax
| Syntax: | =FORECAST(x, known_y’s, known_x’s) |
Excel FORECAST Function Arguments
| Argument | Description |
| x | This is the next data point that you want to forecast. E.g. it might be a date, or period |
| known_y’s | The range of cells containing your historical values you’re basing your forecast on |
| known_x’s | The range of cells containing the periods you already know |
Notes:
- All arguments are required.
- The known y’s and x’s must contain the same number of data points.
- x must be a numeric value, otherwise the #VALUE! Error will be returned.
- The #DIV/0! Error will be returned if the variance of known_x’s equals zero.
Excel FORECAST Function examples
Let’s take some sales data for 2017 that we’d like to forecast for the first 6 months of 2018. In a separate column I’ll insert my FORECAST function:
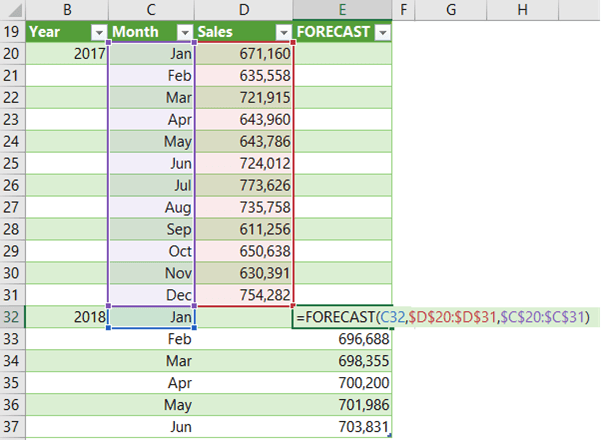
Notice the ‘x’ argument cell reference is relative, so that when I copy the formula down it picks up the next date and so on. Meanwhile the known_x and known_y references are absolute.
BTW, the month names in column C are actually dates formatted to display the month name, thus satisfying the requirement that x values must be numeric.
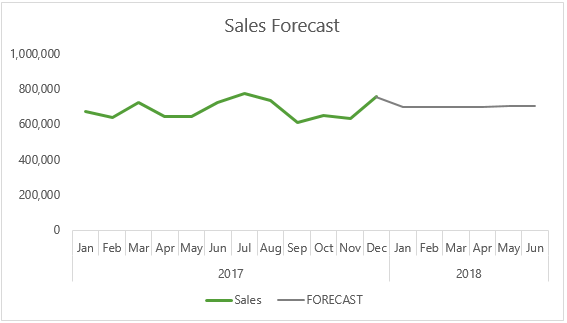
Chart Forecast Data
You might wonder why I entered the forecast in a separate column, and the reason is so that I can plot it in a chart as a separate series, which allows me to colour the forecast part of the line different to the actual sales line:
Leave A Comment?