Situatie
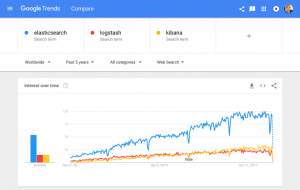
With millions of downloads for its various components since first being introduced, the ELK Stack is the world’s most popular log management platform. In contrast, Splunk — the historical leader in the space — self-reports 15,000 customers in total.
What exactly is ELK? Why is this software stack seeing such widespread interest and adoption? How do the different components in the stack interact? In this guide, we will take a comprehensive look at the different components comprising the stack. We will help you understand what role they play in your data pipelines, how to install and configure them, and how best to avoid some common pitfalls along the way.
Solutie
Pasi de urmat
Up until a year or two ago, the ELK Stack was a collection of three open-source products — Elasticsearch, Logstash, and Kibana — all developed, managed and maintained by Elastic. The introduction and subsequent addition of Beats turned the stack into a four legged project and led to a renaming of the stack as the Elastic Stack.
Elasticsearch is an open source, full-text search and analysis engine, based on the Apache Lucene search engine. Logstash is a log aggregator that collects data from various input sources, executes different transformations and enhancements and then ships the data to various supported output destinations. Kibana is a visualization layer that works on top of Elasticsearch, providing users with the ability to analyze and visualize the data. And last but not least — Beats are lightweight agents that are installed on edge hosts to collect different types of data for forwarding into the stack.
Together, these different components are most commonly used for monitoring, troubleshooting and securing IT environments (though there are many more use cases for the ELK Stack such as business intelligence and web analytics). Beats and Logstash take care of data collection and processing, Elasticsearch indexes and stores the data, and Kibana provides a user interface for querying the data and visualizing it.
The ELK Stack is popular because it fulfills a need in the log management and analytics space. Monitoring modern applications and the IT infrastructure they are deployed on requires a log management and analytics solution that enables engineers to overcome the challenge of monitoring what are highly distributed, dynamic and noisy environments. The ELK Stack helps by providing users with a powerful platform that collects and processes data from multiple data sources, stores that data in one centralized data store that can scale as data grows, and that provides a set of tools to analyze the data.
Of course, the ELK Stack is open source. With IT organizations favoring open source products, this alone could explain the popularity of the stack. Using open source means organizations can avoid vendor lock-in and onboard new talent much more easily. Everyone knows how to use Kibana, right? Open source also means a vibrant community constantly driving new features and innovation and helping out in case of need.
Sure, Splunk has long been a market leader in the space. But its numerous functionalities are increasingly not worth the expensive price — especially for smaller companies such as SaaS products and tech startups. Splunk has about 15,000 customers while ELK is downloaded more times in a single month than Splunk’s total customer count — and many times over at that. ELK might not have all of the features of Splunk, but it does not need those analytical bells and whistles. ELK is a simple but robust log management and analytics platform that costs a fraction of the price.
Why is Log Analysis Becoming More Important?
In today’s competitive world, organizations cannot afford one second of downtime or slow performance of their applications. Performance issues can damage a brand and in some cases translate into a direct revenue loss. For the same reason, organizations cannot afford to be compromised as well, and not complying with regulatory standards can result in hefty fines and damage a business just as much as a performance issue.
To ensure apps are available, performant and secure at all times, engineers rely on the different types of data generated by their applications and the infrastructure supporting them. This data, whether event logs or metrics, or both, enables monitoring of these systems and the identification and resolution of issues should they occur.
Logs have always existed and so have the different tools available for analyzing them. What has changed, though, is the underlying architecture of the environments generating these logs. Architecture has evolved into microservices, containers and orchestration infrastructure deployed on the cloud, across clouds or in hybrid environments. Not only that, the sheer volume of data generated by these environments is constantly growing and constitutes a challenge in itself. Long gone are the days when an engineer could simply SSH into a machine and grep a log file. This cannot be done in environments consisting of hundreds of containers generating TBs of log data a day.
This is where centralized log management and analytics solutions such as the ELK Stack come into the picture, allowing engineers, whether DevOps, IT Operations or SREs, to gain the visibility they need and ensure apps are available and performant at all times.
Modern log management and analysis solutions include the following key capabilities:
- Aggregation – the ability to collect and ship logs from multiple data sources.
- Processing – the ability to transform log messages into meaningful data for easier analysis.
- Storage – the ability to store data for extended time periods to allow for monitoring, trend analysis, and security use cases.
- Analysis – the ability to dissect the data by querying it and creating visualizations and dashboards on top of it.
How to Use the ELK Stack for Log Analysis
As I mentioned above, taken together, the different components of the ELK Stack provide a simple yet powerful solution for log management and analytics. The various components in the ELK Stack were designed to interact and play nicely with each other without too much extra configuration. However, how you end up designing the stack greatly differs on your environment and use case.
For a small-sized development environment, the classic architecture will look as follows:
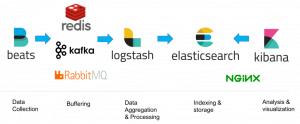
However, for handling more complex pipelines built for handling large amounts of data in production, additional components are likely to be added into your logging architecture, for resiliency (Kafka, RabbitMQ, Redis) and security (nginx):
This is of course a simplified diagram for the sake of illustration. A full production-grade architecture will consist of multiple Elasticsearch nodes, perhaps multiple Logstash instances, an archiving mechanism, an alerting plugin and a full replication across regions or segments of your data center for high availability.


Leave A Comment?