Insert Chart – Google Spreadsheet – Foi de calcul Data 15/07/2015 Autor Filip R Categorie Configurare program, Aplicatii specifice, Stații de lucru -8 1685 Configurare noua (How To) SituatieDorim un grafic in functie de valorile dintr-o coloana Solutie Pasi de urmat Apasam pe butonul albastru Apasam pe “+” pentru a adauga o foaie de calcul noua 
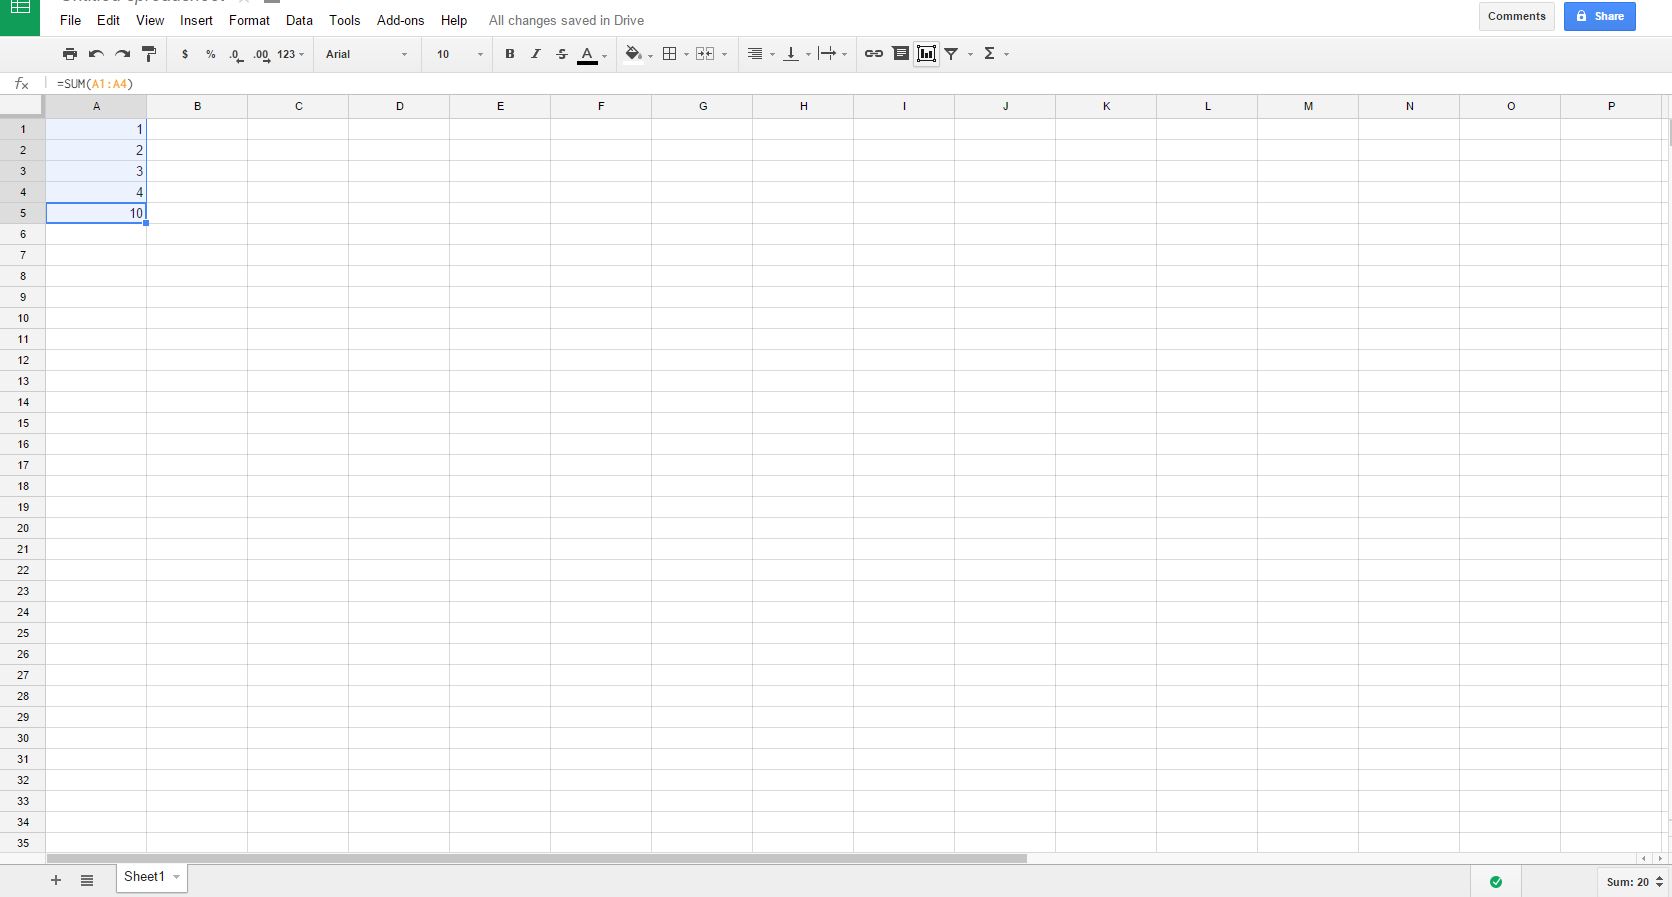
Selectam coloana respectiva si apasam pe a 3-a iconita de sus de la dreapta la stanga, “INSERT CHART” Alegem tipul de grafic dorit si apasam pe INSERT Tip solutiePermanent Voteaza Up Down (19 din 47 persoane apreciaza acest articol) ShareTweetShare Despre Autor Filip R Solutii Asemanatoare Cum adăugați un ceas suplimentar în Windows 11 0 Configuring a USB mouse/peripheral with proprietary software without direct installation of its software -2 Interogarea si compunerea informatiilor din winver folosind windows powershell -1 Activare/dezactivare rapida Windows 10 Features folosind Run v.2 -1 Windows 10 – Accesarea item-ului Fonts din Control Panel folosind Run -1 How to enable and set up AutoMod for a secured Discord Server 3 Leave A Comment? × Cancel Reply Save my name, email, and website in this browser for the next time I comment. + seven = twelve
Leave A Comment?