Configurare program

How to Use a Virtual Background in Zoom for Android

If you’re one of the millions of people that have used Zoom for video conferencing, you know that virtual backgrounds are a big deal. These virtual backgrounds can replace the real background behind you. The Android app can also use this feature, here’s how to do it.

The Zoom app doesn’t support virtual backgrounds for all Android devices. It seems that only relatively new and powerful devices have the feature. Before we get started, head to the Google Play Store and make sure Zoom is updated to the latest version.

[mai mult...]

How to Use Port Knocking on Linux (and Why You Shouldn’t)

Hand knocking on a closed door.
Port knocking is a way to secure a server by closing firewall ports—even those you know will be used. Those ports are opened on demand if—and only if—the connection request provides the secret knock.

In the 1920s, when prohibition was in full swing, if you wanted to get into a speakeasy, you had to know the secret knock and tap it out correctly to get inside.

Port knocking is a modern equivalent. If you want people to have access to services on your computer but don’t want to open your firewall to the internet, you can use port knocking. It allows you to close the ports on your firewall that allow incoming connections and have them open automatically when a prearranged pattern of connection attempts is made. The sequence of connection attempts acts as the secret knock. Another secret knock closes the port.

Port knocking is something of a novelty, but it’s important to know it’s an example of security through obscurity, and that concept is fundamentally flawed. The secret of how to access a system is safe because only those in a specific group know it. But once that secret is out—either because it’s revealed, observed, guessed, or worked out—your security is void. You’re better off securing your server in other, stronger ways, like requiring key-based logins for an SSH server.

The most robust approaches to cybersecurity are multilayered, so, perhaps port knocking should be one of those layers. The more layers, the better, right? However, you could argue that port knocking doesn’t add much (if anything) to a properly hardened, secure system.

Cybersecurity is a vast and complicated topic, but you shouldn’t use port knocking as your only form of defense.

Installing knockd

To demonstrate port knocking, we’re going to use it to control port 22, which is the SSH port. We’ll use a tool called knockd. Use apt-get to install this package onto your system if you use Ubuntu or another Debian-based distribution. On other Linux distributions, use your Linux distribution’s package management tool, instead.

Type the following:

sudo apt-get install knockd

"sudo apt-get install knockd" command in a terminal window.

You probably already have the iptables firewall installed on your system, but you might need to install the iptables-persistent package. It handles the automatic loading of saved iptable rules.

Type the following to install it:

sudo apt-get install iptables-persistent

"sudo apt-get install iptables-persistent" command in a terminal window.

When the IPV4 configuration screen appears, press the space bar to accept the “Yes” option.

Press the space bar to accept the "Yes" option in the iptables-persistent IPV4 screen.

Press the space bar again in IPv6 configuration screen to accept the “Yes” option and move on.

Press the space bar to accept the "Yes" option in the IPv6 configuration screen.

The following command tells iptables to allow established and ongoing connections to continue. We’ll now issue another command to close the SSH port.

If someone is connected by SSH when we issue this command, we don’t want them to be cut off:

sudo iptables -A INPUT -m conntrack --ctstate ESTABLISHED,RELATED -j ACCEPT

"sudo iptables -A INPUT -m conntrack --ctstate ESTABLISHED,RELATED -j ACCEPT" command in a terminal window.

This command adds a rule to the firewall, that says:

  • -A: Append the rule to the firewall rules table. That is, add it to the bottom.
  • INPUT: This is a rule about incoming connections.
  • -m conntrack: Firewall rules act upon network traffic (packets) that match criteria in the rule. The -m parameter causes iptables to use extra packet matching modules—in this case, the one called conntrack works with the network connection tracking capabilities of the kernel.
  • –cstate ESTABLISHED,RELATED: This specifies the type of connection to which the rule will apply, namely ESTABLISHED and RELATED connections. An established connection is one that’s already in progress. A related connection is one that’s made due to an action from an established connection. Perhaps someone who is connected wants to download a file; that might happen over a new connection initiated by the host.
  • -j ACCEPT: If the traffic matches the rule, jump to the ACCEPT target in the firewall. In other words, the traffic is accepted and allowed to pass through the firewall.

Now we can issue the command to close the port:

sudo iptables -A INPUT -p tcp --dport 22 -j REJECT

"sudo iptables -A INPUT -p tcp --dport 22 -j REJECT in a terminal window" command in a terminal window.

This command adds a rule to the firewall, that says:

  • -A: Append the rule to the firewall rules table, i.e., add it to the bottom.
  • INPUT: This rule is about incoming connections.
  • -p tcp: This rule applies to traffic that uses the Transmission Control Protocol.
  • –dport 22: This rule specifically applies to TCP traffic that targets port 22 (the SSH port).
  • -j REJECT: If the traffic matches the rule, jump to the REJECT target in the firewall. So, if the traffic is rejected, it’s not permitted through the firewall.

We must start the netfilter-persistent daemon. We can do so with this command:

sudo systemctl start netfilter-persistent

"sudo systemctl start netfilter-persistent" in a terminal window.

We want netfilter-persistent to go through a save and reload cycle, so it loads and controls the iptable rules.

Type the following commands:

sudo netfilter-persistent save

"sudo netfilter-persistent save" in a terminal window.

sudo netfilter-persistent reload

"sudo netfilter-persistent reload" in a terminal window.

You’ve now installed the utilities, and the SSH port is closed (hopefully, without terminating anyone’s connection). Now, it’s time to configure the secret knock.

Configuring knockd

There are two files you edit to configure knockd. The first is the following knockd configuration file:

sudo gedit /etc/knockd.conf

"sudo gedit /etc/knockd.conf" in a terminal window.

The gedit editor opens with the knockd configuration file loaded.

The knockd config file in the gedit editor.

We’ll edit this file to suit our needs. The sections we’re interested in are “openSSH” and “closeSSH.” The following four entries are in each section:

  • sequence: The sequence of ports someone must access to open or close port 22. The default ports are 7000, 8000, and 9000 to open it, and 9000, 8000, and 7000 to close it. You can change these or add more ports to the list. For our purposes, we’ll stick with the defaults.
  • seq_timeout: The time period within which someone has to access the ports to trigger it to open or close.
  • command: The command sent to the iptables firewall when the open or close action is triggered. These commands either add a rule to the firewall (to open the port) or take it out (to close the port).
  • tcpflags: The type of packet each port must receive in the secret sequence. A SYN (synchronize) packet is the first in a TCP connection request, called a three-way handshake.

The “openSSH” section can be read as “a TCP connection request must be made to ports 7000, 8000, and 9000—in that order and within 5 seconds—for the command to open port 22 to be sent to the firewall.”

The “closeSSH” section can be read as “a TCP connection request must be made to ports 9000, 8000, and 7000—in that order and within 5 seconds—for the command to close port 22 to be sent to the firewall.”

The Firewall Rules

The “command” entries in the openSSH and closeSSH sections remain the same, except for one parameter. This is how they’re comprised:

  • -A: Append the rule to the bottom of the firewall rules list (for the openSSH command).
  • -D: Delete the command from the firewall rules list (for the closeSSH command).
  • INPUT: This rule is concerned with incoming network traffic.
  • -s %IP%: The IP address of the device requesting a connection.
  • -p: Network protocol; in this case, it’s TCP.
  • –dport: The destination port; in our example, it’s port 22.
  • -j ACCEPT: Jump to the accept target within the firewall. In other words, let the packet drop through the rest of the rules without acting on it.

The knockd Configuration File Edits

The edits we’ll make to the file are highlighted in red below:

The knockd config file in the gedit editor with the edits highlighted.

We extend the “seq_timeout” to 15 seconds. This is generous, but if someone’s manually firing in connection requests, he might need this much time.

In the “openSSH” section, we change the -A (append) option in the command to -I (insert). This command inserts a new firewall rule at the top of the firewall rule list. If you leave the -A option, it appends the firewall rule list and puts it at the bottom.

Incoming traffic is tested against each firewall rule in the list from the top down. We already have a rule that closes port 22. So, if incoming traffic is tested against that rule before it sees the rule that allows the traffic, the connection is refused; if it sees this new rule first, the connection is allowed.

The close command removes the rule added by openSSH from the firewall rules. SSH traffic is once more handled by the pre-existing “port 22 is closed” rule.

After you make these edits, save the configuration file.

The knockd Control File Edits

The knockd control file is altogether simpler. Before we dive in and edit that, though, we need to know the internal name for our network connection; to find it, type this command:

ip addr

The "ip addr" command in a terminal window.

The connection this machine uses to research this article is called enp0s3. Make a note of the name of your connection.

The following command edits the knockd control file:

sudo gedit /etc/default/knockd

"sudo gedit /etc/default/knockd" command in a terminal window.

Here’s the knockd file in gedit.

The knockd control file in gedit.

The few edits we need to make are highlighted in red:

The knockd control file in gedit with the edits highlighted.

We changed the “START_KNOCKD=” entry to from 0 to 1.

We also removed the hash # from the start of the “KNOCKD_OPTS=” entry, and replaced “eth1” with the name of our network connection, enp0s3. Of course, if your network connection is eth1, you won’t change it.

The Proof Is in the Pudding

It’s time to see if this works. We’ll start the knockd daemon with this command:

sudo systemctrl start knockd

"sudo systemctrl start knockd" command in a terminal window.

Now, we’ll jump on another machine and try to connect. We installed the knockd tool on that computer, too, not because we want to set up port knocking, but because the knockd package provides another tool called knock. We’ll use this machine to fire in our secret sequence and do the knocking for us.

Use the following command to send your secret sequence of connection requests to the ports on the port knocking host computer with the IP address 192.168.4.24:

knock 192.168.4.24 7000 8000 9000 -d 500

This tells knock to target the computer at IP address 192.168.4.24 and fire a connection request to ports 7000, 8000, and 9000, in turn, with a -d (delay) of 500 milliseconds between them.

A user called “dave” then makes an SSH request to 192.168.4.24:

ssh dave@192.168.4.24

His connection is accepted, he enters his password, and his remote session begins. His command prompt changes from dave@nostromo to dave@howtogeek. To log out of the remote computer, he types:

exit

His command prompt returns to his local computer. He uses knock once more, and this time, it targets the ports in reverse order to close the SSH port on the remote computer.

knock 192.168.4.24 9000 8000 7000 -d 500

Port knocking and ssh connection session in a terminal window.

Admittedly, this wasn’t a particularly fruitful remote session, but it demonstrates the opening and closing of the port via port knocking and fits in a single screenshot.

So, what did this look like from the other side? The system administrator on the port knocking host uses the following command to view new entries that arrive in the system log:

tail -f /var/log/syslog

A syslog showing the port knocking events in a terminal window.

  • You see three openSSH entries. These are raised as each port is targeted by the remote knock utility.
  • When all three stages of the trigger sequence are met, an entry that says “OPEN SESAME,” is logged
  • The command to insert the rule into the iptables rules list is sent. It permits access via SSH on port 22 from the specific IP address of the PC that gave the correct secret knock (192.168.4.23).
  • The user “dave” connects for a few seconds only, and then disconnects.
  • You see three closeSSH entries. These are raised as each port is targeted by the remote knock utility—it tells the port knocking host to close port 22.
  • After all three stages are triggered, we get the “OPEN SESAME” message again. The command is sent to the firewall to remove the rule. (Why not “CLOSE SESAME” when it’s closing the port? Who knows?)

Now the only rule in the iptables rules list regarding port 22 is the one we typed at the beginning to close that port. So, port 22 is now closed again.

[mai mult...]

Transform Your Wireshark Workflow with Brim on Linux

Wireshark Is Great, But . . .

Wireshark is a wonderful piece of open-source software. It’s used by amateurs and professionals alike worldwide to investigate networking issues. It captures the data packets that travel down the wires or through the ether of your network. Once you’ve captured your traffic, Wireshark allows you to filter and search through the data, trace conversations between network devices, and much more.

As great as Wireshark is, though, it does have one issue. Network data capture files (called network traces or packet captures), can get very large, very quickly. This is especially true if the issue you’re trying to investigate is complex or sporadic, or the network is large and busy.

The larger the packet capture (or PCAP), the more laggy Wireshark becomes. Just opening and loading a very large (anything over 1 GB) trace can take so long, you’d think Wireshark had keeled over and given up the ghost.

Working with files of that size is a real pain. Every time you perform a search or change a filter, you have to wait for the effects to be applied to the data and updated on the screen. Each delay disrupts your concentration, which can hinder your progress.

Brim is the remedy for these woes. It acts as an interactive preprocessor and front-end for Wireshark. When you want to see the granular level Wireshark can provide, Brim instantly opens it for you exactly on those packets.

If you do a lot of network capture and packet analysis, Brim will revolutionize your workflow.

Installing Brim

Brim is very new, so it hasn’t yet made its way into the software repositories of the Linux distributions. However, on the Brim download page, you’ll find DEB and RPM package files, so installing it on Ubuntu or Fedora is simple enough.

If you use another distribution, you can download the source code from GitHub and build the application yourself.

Brim uses zq, a command-line tool for Zeek logs, so you’ll also need to download a ZIP file containing the zq binaries.

Installing Brim on Ubuntu

If you’re using Ubuntu, you’ll need to download the DEB package file and zq Linux ZIP file. Double-click the downloaded DEB package file, and the Ubuntu Software application will open. The Brim license is mistakenly listed as “Proprietary”—it uses the BSD 3-Clause License.

Click “Install.”

Click "Install."

When the installation is complete, double-click the zq ZIP file to launch the Archive Manager application. The ZIP file will contain a single directory; drag and drop it from the “Archive Manager” to a location on your computer, like the “Downloads” directory.

We type the following to create a location for the zq binaries:

sudo mkdir /opt/zeek

sudo mkdir /opt/zeek in a terminal window.

We need to copy the binaries from the extracted directory to the location we just created. Substitute the path and name of the extracted directory on your machine in the following command:

sudo cp Downloads/zq-v0.20.0.linux-amd64/* /opt/Zeek

sudo cp Downloads/zq-v0.20.0.linux-amd64/* /opt/Zeek in a terminal window.

We need to add that location to the path, so we’ll edit the BASHRC file:

sudo gedit .bashrc

sudo gedit .bashrc in a terminal window.

The gedit editor will open. Scroll to the bottom of the file, and then type this line:

export PATH=$PATH:/opt/zeek

The BASHRC file in the gedit editor with the line export PATH=$PATH:/opt/zeek.

Save your changes and close the editor.

Installing Brim on Fedora

To install Brim on Fedora, download the RPM package file (instead of the DEB), and then follow the same steps we covered for the Ubuntu installation above.

Interestingly, when the RPM file opens in Fedora, it’s correctly identified as having an open-source license, rather than a proprietary one.

Launching Brim

Click “Show Applications” in the dock or press Super+A. Type “brim” in the Search box, and then click “Brim” when it appears.

Type "brim" in the Search box.

Brim launches and displays its main window. You can click “Choose Files” to open a file browser, or drag and drop a PCAP file in the area surrounded by the red rectangle.

The Brim main window after startup.

Brim uses a tabbed display, and you can have multiple tabs open simultaneously. To open a new tab, click the plus sign (+) at the top, and then select another PCAP.

Brim Basics

Brim loads and indexes the selected file. The index is one of the reasons Brim is so fast. The main window contains a histogram of packet volumes over time, and a list of network “flows.”

The Brim main window with a PCAP file loaded.

A PCAP file holds a time-ordered stream of network packets for a great many network connections. The data packets for the various connections are intermingled because some of them will have been opened concurrently. The packets for each network “conversation” are interspersed with the packets of other conversations.

Wireshark displays the network stream packet by packet, while Brim uses a concept called “flows.” A flow is a complete network interchange (or conversation) between two devices. Each flow type is categorized, color coded, and labeled by flow type. You’ll see flows labeled “dns,” “ssh,” “https,” “ssl,” and many more.

If you scroll the flow summary display left or right, many more columns will be displayed. You can also adjust the time period to display the subset of information you want to see. Below are a few ways you can view data:

  • Click a bar in the histogram to zoom in on the network activity within it.
  • Click and drag to highlight a range of the histogram display and zoom in. Brim will then display the data from the highlighted section.
  • You can also specify exact periods in the “Date” and “Time” fields.

Brim can display two side panes: one on the left, and one on the right. These can be hidden or remain visible. The pane on the left shows a search history and list of open PCAPs, called spaces. Press Ctrl+[ to toggle the left pane on or off.

The "Spaces" pane in Brim.

The pane on the right contains detailed information about the highlighted flow. Press Ctrl+] to toggle the right pane on or off.

A highlighted "Fields" pane on Brim.

Click “Conn” in the “UID Correlation” list to open a connection diagram for the highlighted flow.

Click "Conn."

In the main window, you can also highlight a flow, and then click the Wireshark icon. This launches Wireshark with the packets for the highlighted flow displayed.

Click the Wireshark icon in the Brim main window.

Wireshark opens, displaying the packets of interest.

Packets selected from Brim displayed in Wireshark.

Filtering in Brim

Searching and filtering in Brim are flexible and comprehensive, but you don’t have to learn a new filtering language if you don’t want to. You can build a syntactically correct filter in Brim by clicking fields in the summary window, and then selecting options from a menu.

For example, in the image below, we right-clicked a “dns” field. We’re then going to select “Filter = Value” from the context menu.

A context menu in the summary window.

The following things then occur:

  • The text _path = "dns" is added to the search bar.
  • That filter is applied to the PCAP file, so it will only display flows that are Domain Name Service (DNS) flows.
  • The filter text is also added to the search history in the left pane.

A summary screen filtered by DNS.

We can add further clauses to the search term using the same technique. We’ll right-click the IP address field (containing “192.168.1.26”) in the “Id.orig_h” column, and then select “Filter = Value” from the context menu.

This adds the additional clause as an AND clause. The display is now filtered to show DNS flows that originated from that IP address (192.168.1.26).

A summary screen filtered by flow type and IP address.

The new filter term is added to the search history in the left pane. You can hop between searches by clicking the items in the search history list.

The destination IP address for most of our filtered data is 81.139.56.100. To see which DNS flows were sent to different IP addresses, we right-click “81.139.56.100” in the “Id_resp_h” column, and then select “Filter != Value” from the context menu.

Summary screen with a search filter containing an "!=" clause.

Only one DNS flow that originated from 192.168.1.26 wasn’t sent to 81.139.56.100, and we’ve located it without having to type anything to create our filter.

Pinning Filter Clauses

When we right-click an “HTTP” flow and select “Filter = Value” from the context menu, the summary pane will display only HTTP flows. We can then click the Pin icon next to the HTTP filter clause.

Click the Pin icon.

The HTTP clause is now pinned in place, and any other filters or search terms we use will be executed with the HTTP clause prepended to them.

If we type “GET” in the search bar, the search will be restricted to flows that have already been filtered by the pinned clause. You can pin as many filter clauses as necessary.

"GET" in the Search box.

To search for POST packets in the HTTP flows, we simply clear the search bar, type “POST,” and then press Enter.

"POST" in the Search box executed with the pinned "HTTP" clause.

Scrolling sideways reveals the ID of the remote host.

The remote "Host" column in the Brim summary screen.

All the search and filter terms are added to the “History” list. To reapply any filter, just click it.

The auto-populated "History" list.

You can also search for a remote host by name.

Searching for "trustwave.com" in Brim.

Editing Search Terms

If you want to search for something, but don’t see a flow of that type, you can click any flow and edit the entry in the search bar.

For example, we know there must be at least one SSH flow in the PCAP file because we used rsync to send some files to another computer, but we can’t see it.

So, we’ll right-click another flow, select “Filter = Value” from the context menu, and then edit the search bar to say “ssh” instead of “dns.”

We press Enter to search for SSH flows and find there’s only one.

An SSH flow in the summary window.

Pressing Ctrl+] opens the right pane, which shows the details for this flow. If a file was transferred during a flow, the MD5, SHA1, and SHA256 hashes appear.

Right-click any of these, and then select “VirusTotal Lookup” from the context menu to open your browser at the VirusTotal website and pass in the hash for checking.

VirusTotal stores the hashes of known malware and other malicious files. If you’re unsure whether a file is safe, this is an easy way to check, even if you no longer have access to the file.

The hash context menu options.

If the file is benign, you’ll see the screen shown in the image below.

A "No Matches Found" response from the VirusTotal site.

[mai mult...]

Multifunctionala Konica Minolta bizhub 363

Operaţii utile de scanare în reţea

Înregistrarea destinaţiilor utilizate frecvent
Destinaţiile utilizate frecvent pot fi înregistrate.
Destinaţiile pot fi înregistrate în agenda electronică sau ca destinaţii de grup.

Destinaţii în agenda electronică
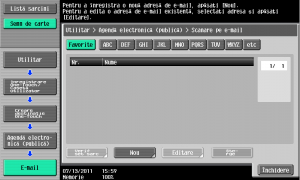
Prin înregistrarea unei destinaţii frecvent utilizate în agenda electronică, destinaţia poate fi preluată simplu,
prin apăsarea pe un buton al agendei electronice.
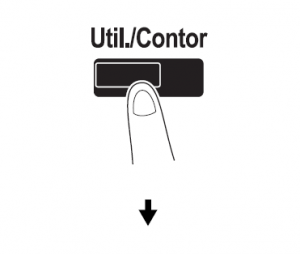
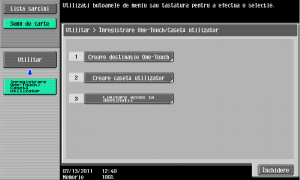
Deschiderea ecranului de înregistrare a destinaţiei

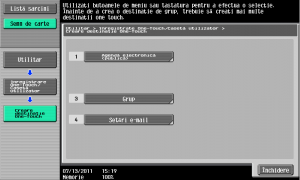
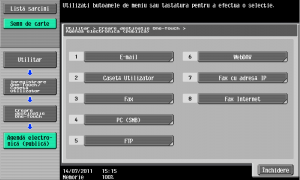
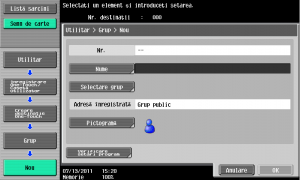
Ecranul de înregistrare a destinaţiei

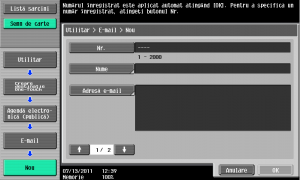
Înregistrarea unei adrese de e-mail

• Nr.: Cu ajutorul tastaturii numerice, tastaţi numărul de înregistrare.
• Nume: Specificaţi numele adresei de e-mail care se va înregistra.
• Adresă e-mail: Utilizaţi tastatura care apare în ecranul tactil pentru a tasta adresa de e-mail.
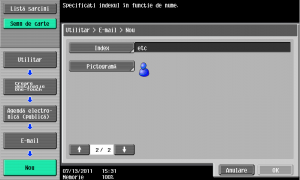
• Index: Selectaţi caracterele index utilizate pentru organizarea adreselor de e-mail. Prin selectarea
caracterelor index adecvate pentru numele înregistrat, adresa de e-mail poate fi găsită cu uşurinţă.
• Pictogramă: Când i-Option LK-101 este activat la acest aparat, selectaţi o pictogramă.

Destinaţii de grup
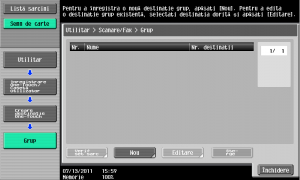
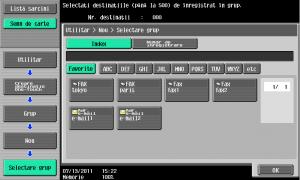
Se pot înregistra mai multe destinaţii, sub forma unui singur grup.
Destinaţiile care pot fi înregistrate ca destinaţie de grup trebuie înregistrate în agenda electronică.
Pentru înregistrarea unei destinaţii de grup, destinaţiile individuale trebuie mai întâi înregistrate în agenda
electronică.
În ecranul Creare destinaţie One-Touch, atingeţi [Grup].

Înregistrarea destinaţiei de program
Setările de scanare, setările de transmisie şi destinaţia pot fi înregistrate cu un singur buton. Acestea se
numesc destinaţii de program. Destinaţiile de program înregistrate pot fi uşor reapelate şi utilizate.

[mai mult...]