Situatie
Solutie
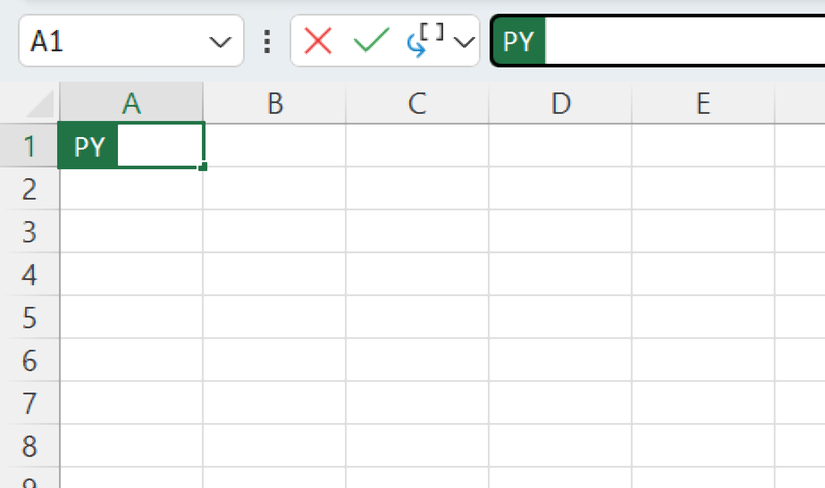
Technically, Python doesn’t run on your local computer; it operates within the Microsoft Cloud. This means it won’t slow down your laptop (all the “thinking” happens on Microsoft’s high-speed servers), but you do need an internet connection to use it. The gateway to this power is the =PY() function. Typing =PY into the formula bar and pressing Tab opens Excel’s Python editing mode.
From a security standpoint, the process is designed to be highly controlled and “sandboxed.” Python reads your Excel tables via the xl() function, does the heavy lifting in the cloud, and then “spills” the results back into your cells. Because the environment is sandboxed, Python can’t access your local files—it only interacts with the specific data you explicitly choose to send it.
How to get started with Python in Excel
Some pointers to be aware of
Before you start typing or pasting code, keep these five things in mind:
- Microsoft 365 only: You need an active subscription and an internet connection.
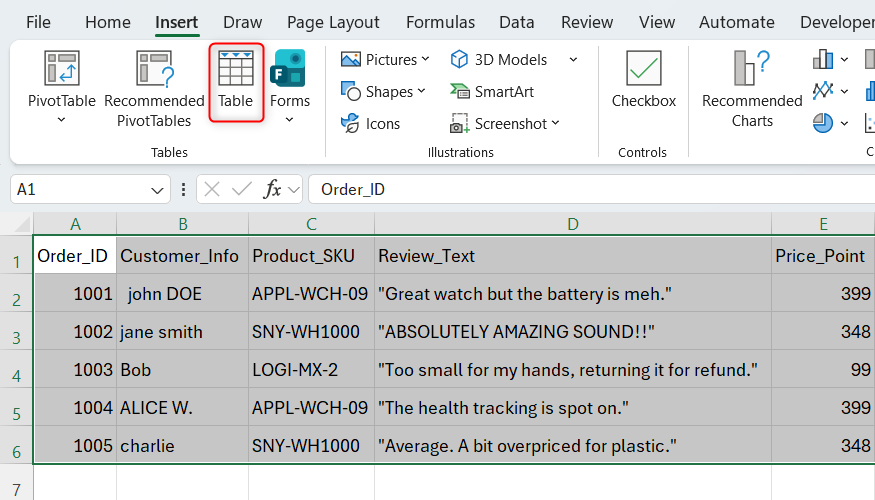
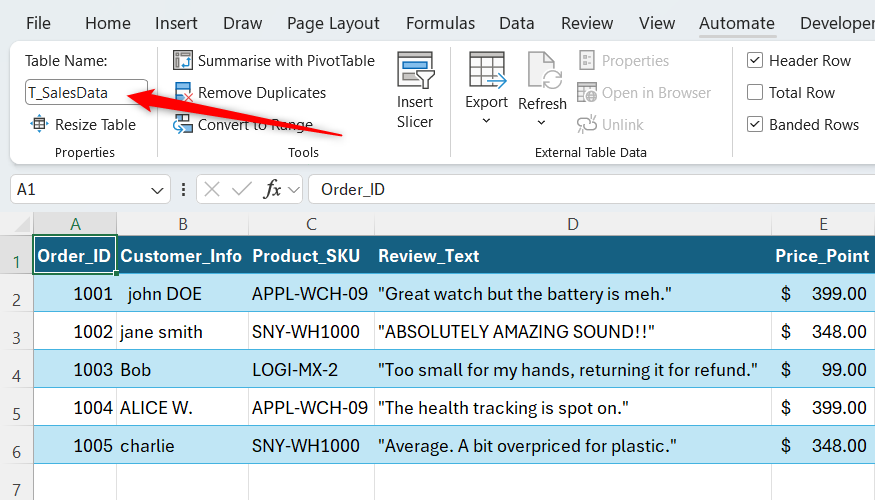
- Convert to table: Python reads structured tables more reliably than loose ranges. So, before you start using it, turn your data into a table (Insert > Table or Ctrl+T), and use the Table Name field of the Table Design tab to name the table something like T_SalesData. That said, Python code can’t go inside Excel tables if the results spill down a column, so in these cases, enter them in a regular cell outside formatted Excel tables.
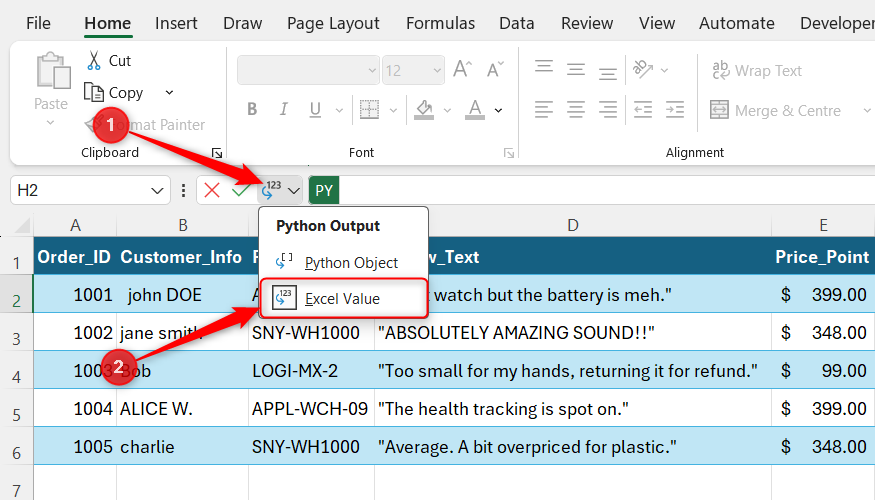
- The output toggle: After typing =PY into the formula bar and pressing Tab, ensure the output type is set to Excel Value so you can see the actual text or numbers it produces.
- The commit: In Python mode, pressing Enter just creates a new line. You must press Ctrl+Enter to run your code.
- Straight quotes: If you copy code from a website or a Word document that uses curly (smart) quotes, Python will return an error. Make sure you replace these with straight quotes.
Setting up the example dataset
A simple real-world scenario
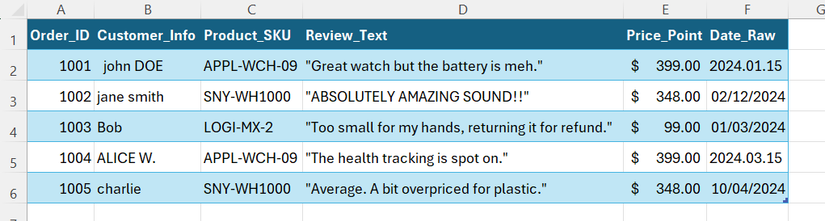
Now that we’ve covered the essentials, it’s time to dive in. Suppose you’ve been given the messy Excel dataset shown above (named T_SalesData). You’ve been asked to clean this data and extract insights from it.
Here’s how you can use Python to get the job done—and quickly.
Use case 1: Fix spacing and capitalization
Cleaning text in a single line of code
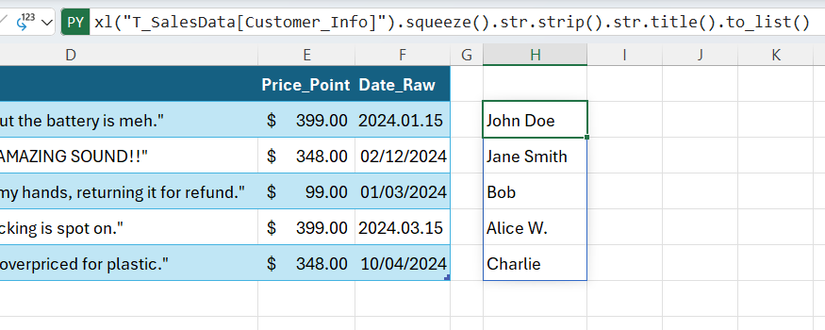
The Customer_Info data in column B is inconsistently capitalized and has some leading and trailing spaces. To create a new list of names that is clean and dynamic, type =PY into a blank cell, press Tab, paste this code, and press Ctrl+Enter:
xl("T_SalesData[Customer_Info]").squeeze().str.strip().str.title().to_list()
Here’s how it works:
| Code | What it does |
|---|---|
| xl(“T_SalesData[Customer_Info]”) | Takes the Customer_Info column from the T_SalesData table |
| .squeeze() | Flattens the column into a one-dimensional list |
| .str.strip() | Removes leading and trailing spaces |
| .str.title() | Capitalizes each word |
| .to_list() | Converts the cleaned data into a list |
Instead of typing the xl(…) reference manually, simply select the range while in Python mode, and Excel will write it for you.
Why this method beats the old ways
Use case 2: Standardize impossible dates
Using heuristic logic to fix messy formats
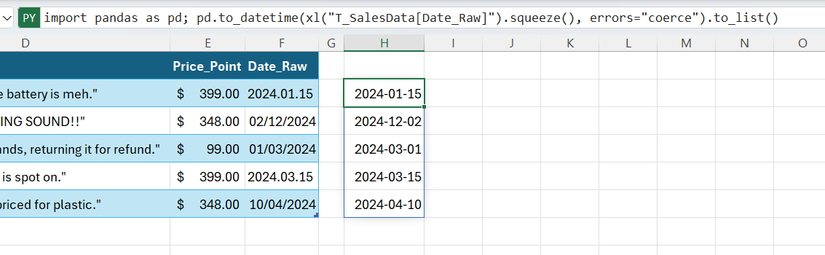
At the moment, the Date_Raw column contains a nightmare of formats—dots, dashes, and text—but Python can sort that in no time. Paste the following code and press Ctrl+Enter:
import pandas as pd; pd.to_datetime(xl("T_SalesData[Date_Raw]").squeeze(), errors="coerce").to_list()
Here’s what’s happening:
| Code | What it does |
|---|---|
| import pandas as pd; | Prepares the pandas library |
| xl(“T_SalesData[Date_Raw]”) | Takes the Date_Raw column from the T_SalesData table |
| .squeeze() | Flattens the column into a one-dimensional list |
| pd.to_datetime(…, errors=”coerce”) | Converts values to dates and turns unparseable entries to NaT (empty) |
| .to_list() | Converts results into a list |
Why this method beats the old ways
- vs. Excel: Excel’s Text to Columns tool is a one-time fix that often fails if the dates are truly messy.
- vs. Power Query: Power Query works well for structured imports, but messy or inconsistent formats may require extra steps.
Use case 3: Create a professional density plot
Visualizing data clusters
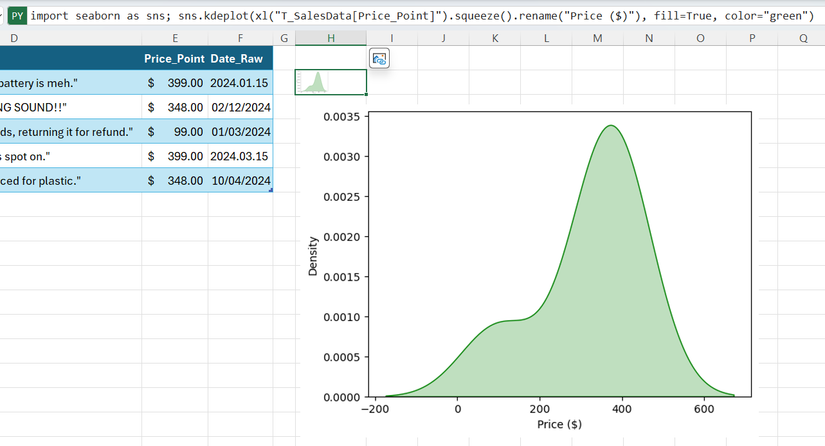
You now want to see where your Price_Points cluster, but a standard histogram looks too “blocky.” Use the following code to create a Kernel Density Estimate (KDE) plot, which shows the probability distribution of a dataset as a smooth curve:
import seaborn as sns; sns.kdeplot(xl("T_SalesData[Price_Point]").squeeze().rename("Price ($)"), fill=True, color="green")
Excel renders Python charts as static in-cell images that update automatically when the underlying data changes. To convert the chart image to a movable object, select the cell and click the Create Reference icon that appears.
Now for the translation:
| Code | What it does |
|---|---|
| import seaborn as sns; | Loads the seaborn library |
| xl(“T_SalesData[Price_Point]”) | Takes the Price_Point column from the T_SalesData table |
| .squeeze() | Flattens the column into a one-dimensional list |
| .rename(“Price ($)”) | Renames the series so that the X-axis is correctly labeled |
| sns.kdeplot(…, fill=True, color=”green”) | Creates a KDE plot with a shaded green area |
Why this method beats the old ways
- vs. Excel: Excel’s histogram forces data into bins. If they’re too wide, you miss the nuances, and if they’re too narrow, the chart looks like a mess of thin sticks.
- vs. Power Query: Power Query can’t create charts—it’s a tool for importing, cleaning, and loading data.
Use case 4: Produce a smart sentiment flagger
Implementing scalable keyword detection
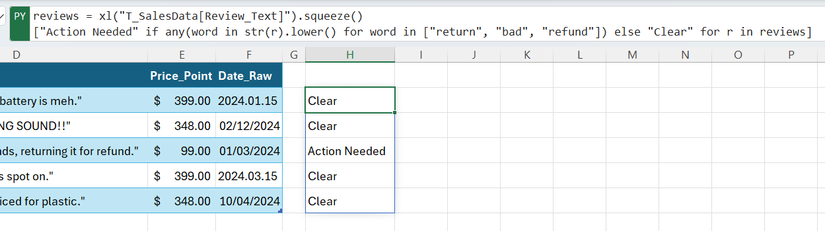
Let’s imagine you have lots of customer reviews in column E. You need to instantly highlight any that contain “red-flag” words like return, bad, or refund. To do this automatically, paste the following and press Ctrl+Enter:
reviews = xl("T_SalesData[Review_Text]").squeeze()
["Action Needed" if any(word in str(r).lower() for word in ["return", "bad", "refund"]) else "Clear" for r in reviews]
Here’s what’s happening:
Why this method beats the old ways
- vs. Excel: To search for multiple words in Excel, you have to nest the ISNUMBER and SEARCH functions inside a giant OR statement. It’s hard to read and even harder to update.
- vs. Power Query: In Power Query, you’d have to add a Conditional Column and manually create a new “Contains” rule for every single keyword. If you have 20 keywords, that’s 20 separate menu interactions.
In contrast, to add a new keyword in the Python code, simply type it into the brackets. What’s more, Python checks for the presence of the word fragment, so searching for “return” will also flag variations like “returning” or “returned.” Just be aware of potential false positives.
Leave A Comment?